Dividend Gems Holds Up as the Stock Market Collapses
Over the past several months we have been publishing the spectacualr outperformance of the securities in the Dividend Gems Recommended List. Here, we show the performance of each of the 45 securities on the DG list versus the S&P 500 Index (in red).
For this analysis, we selected the most recent 1- and 3-month periods for comparison.
Next, we selected the same period minus 5 days (i.e. July 8 - August 8 and May 8 - August 8) to show how the securities declined less than the S&P 500 when the market collapsed. The over the next 5 days the market rallied (August 8 - 12). We show that most of the securities on the DG list also rose more than the S&P 500.
As you will see, even a buy-and-hold strategy has significantly outperformed the S&P 500. You should also note that because these securities have an average yield of about 5.00%, they are expected to actually underperform the S&P 500 with regard to capital appreciation. However, as you will see, even without the dividends, the average performance of the securities on the DG list blew past the S&P 500 Index.
Finally, when the securities guidance and recommendations are added, the outperformance of the DG list was much more impressive. Because it is extremely time-consuming to show this later analysis, we will publish these results in the future. For now, you should study the basic buy-and-hold results in this report.
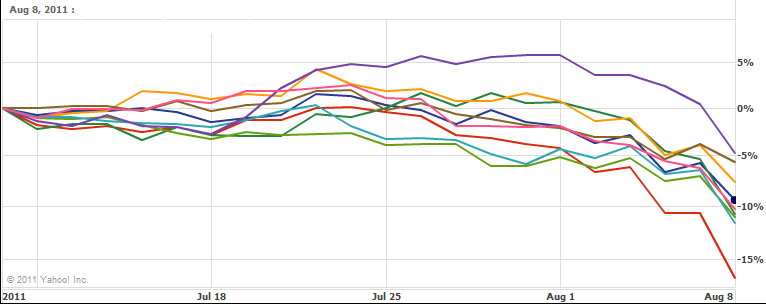
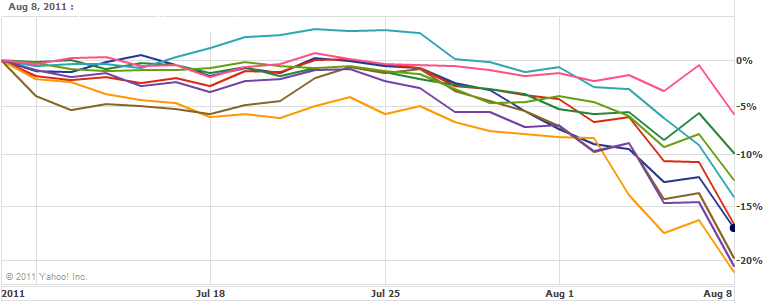
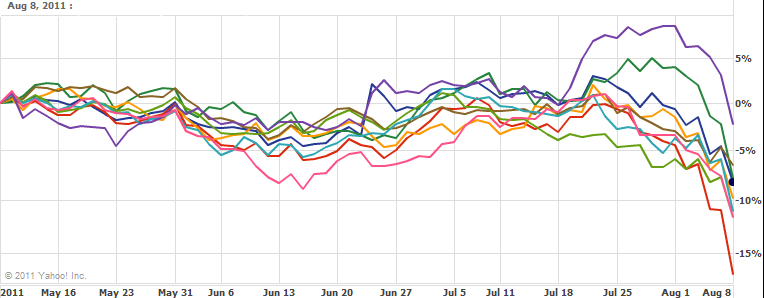
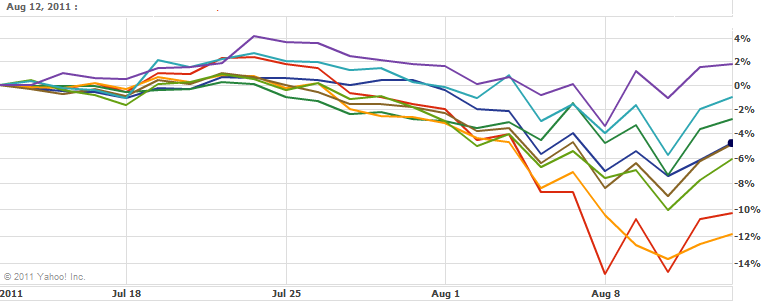
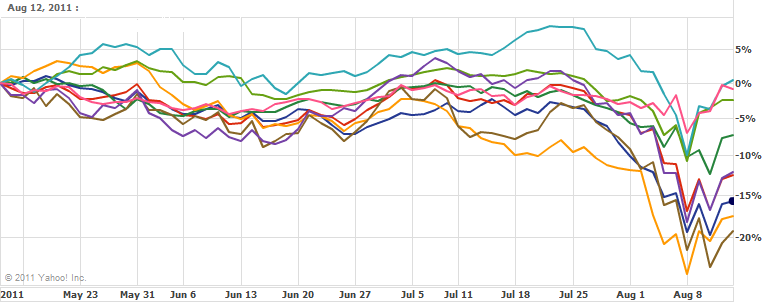
Dividend Gems List: July 8 - August 8
(S&P 500 Index is in red)
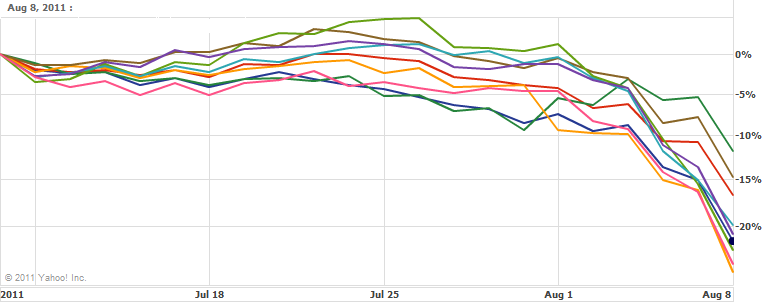
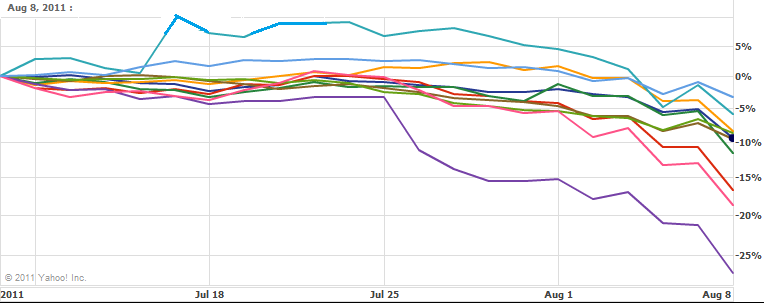
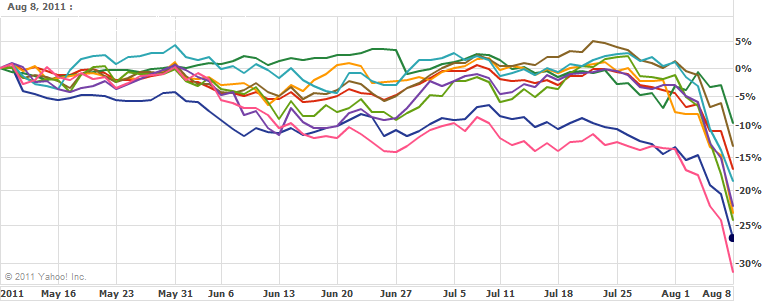
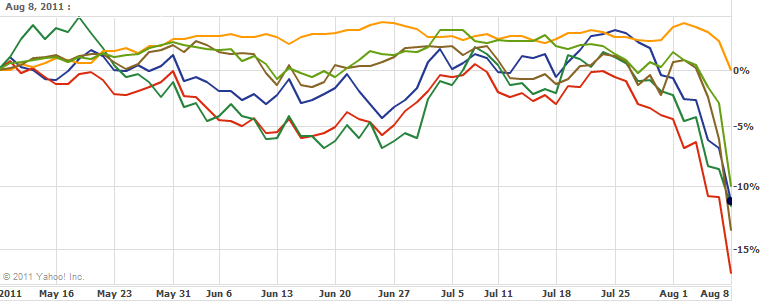
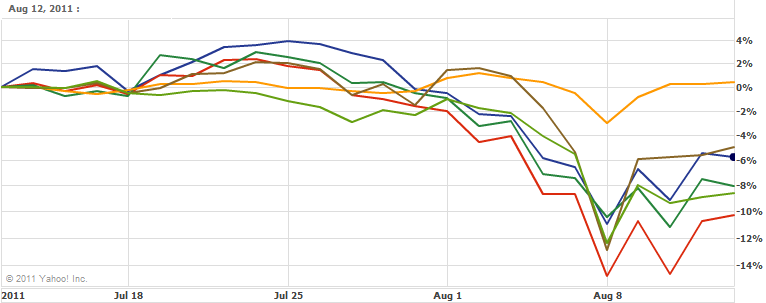
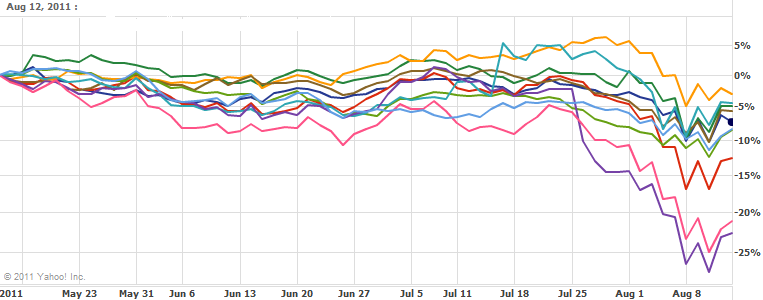
Dividend Gems List: May 8 - August 8
(S&P 500 Index is in red)
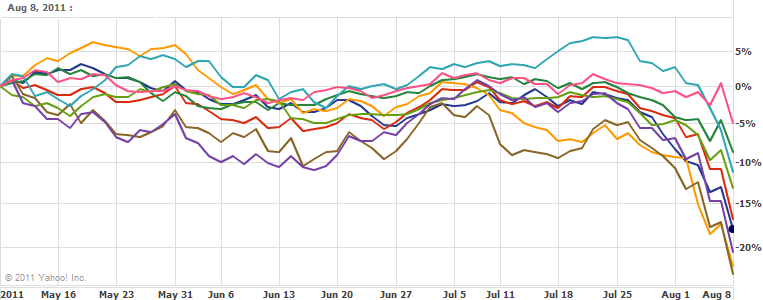

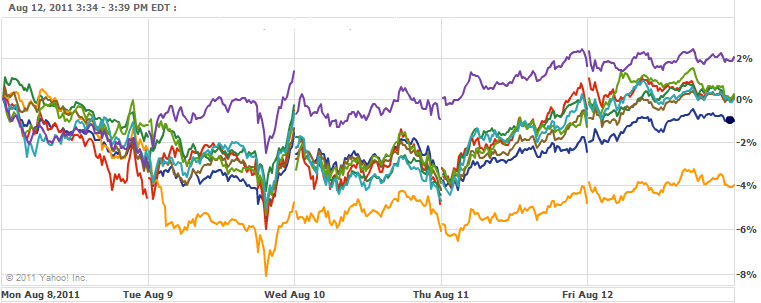
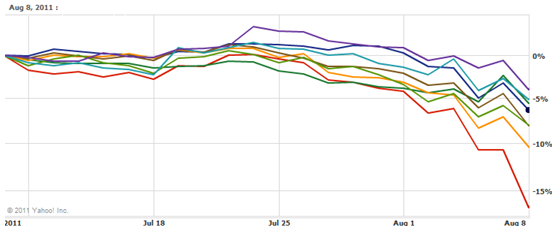
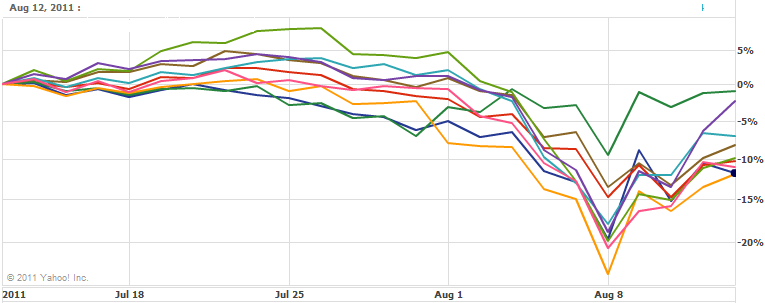
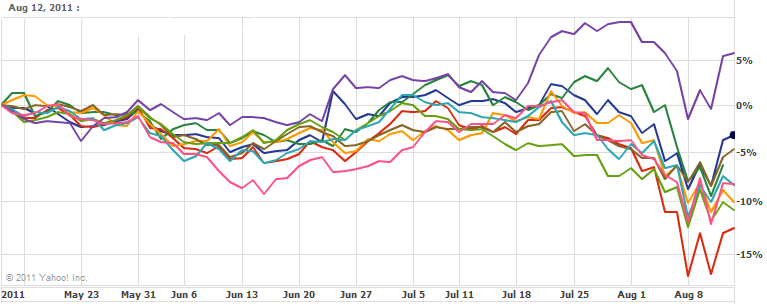
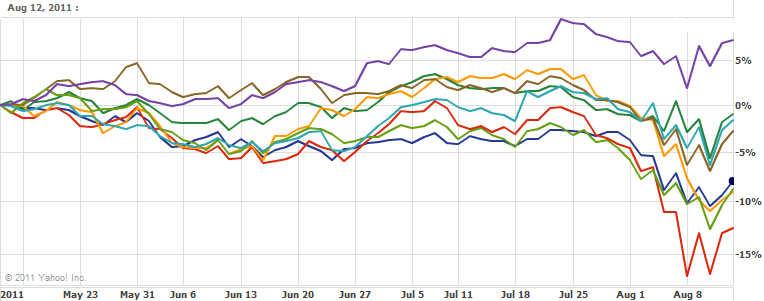
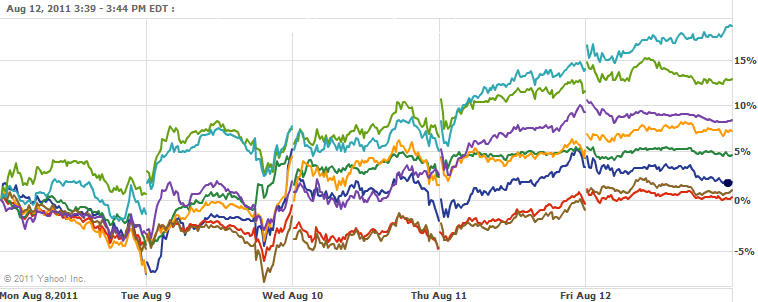
Dividend Gems List: July 12 - August 12
(S&P 500 Index is in red)

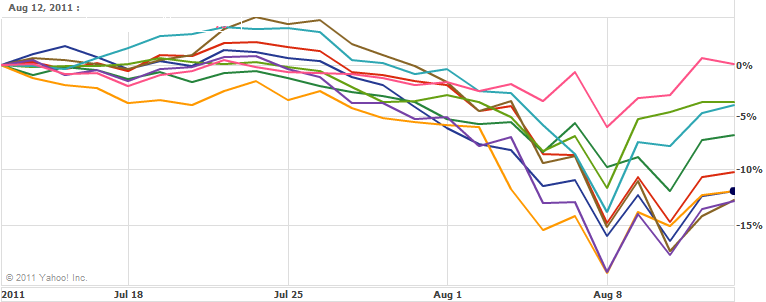
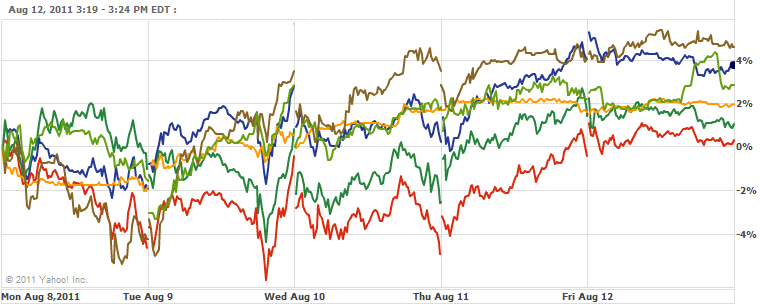
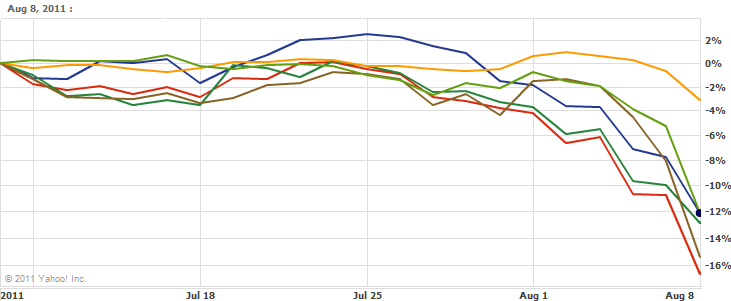
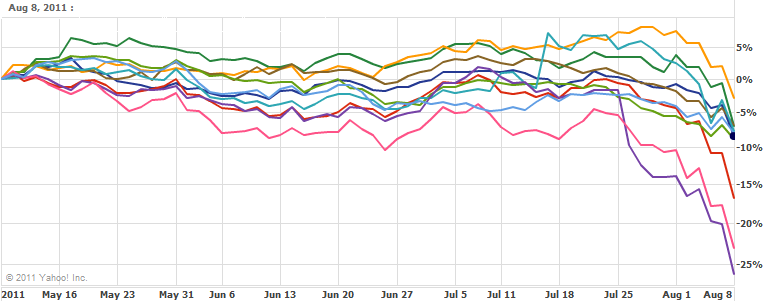
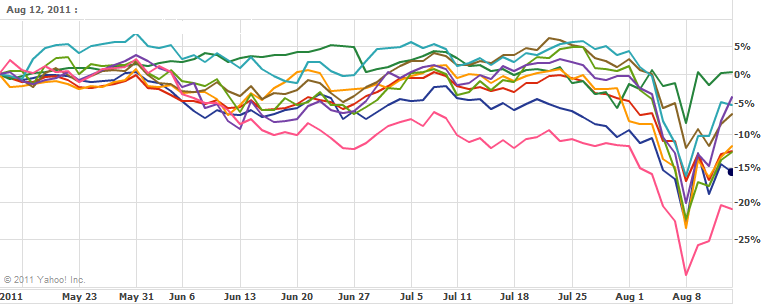
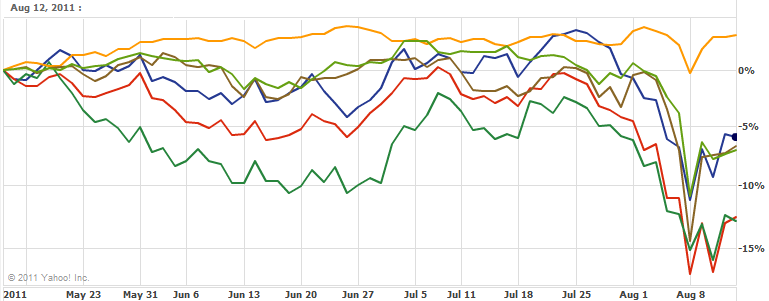
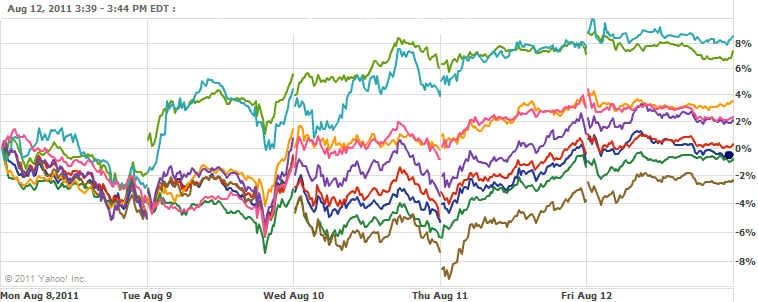
Dividend Gems List: May 12 - August 12
(S&P 500 Index is in red)
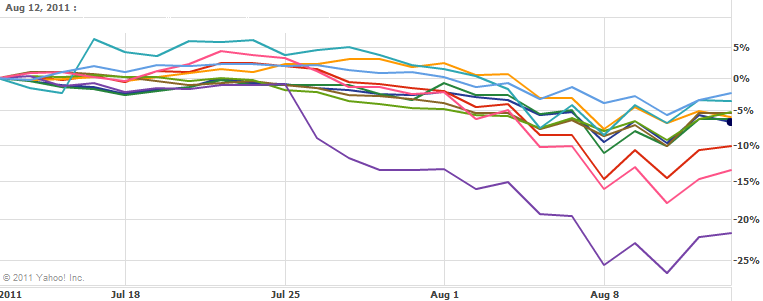
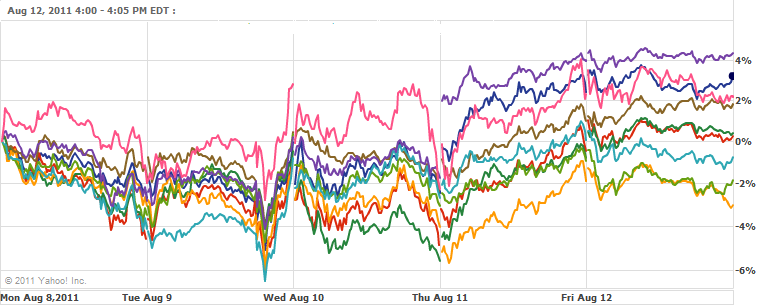
Dividend Gems List: August 8-12
(S&P 500 Index is in red)
.png)