Fool's Gold (Part 2)
In part 1 of this article, I laid out some common sense explanations why gold is best utilized for short-term trading. Furthermore, I emphasized that gold rarely provides a good hedge against inflation. When it does, it’s most often a short-term phenomenon. In Part 2 of this series I’ll demonstrate this.
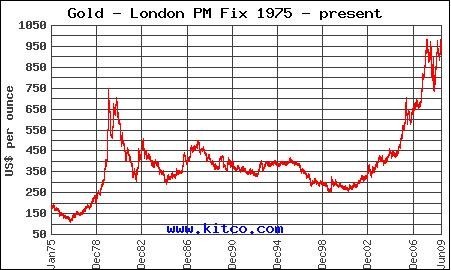
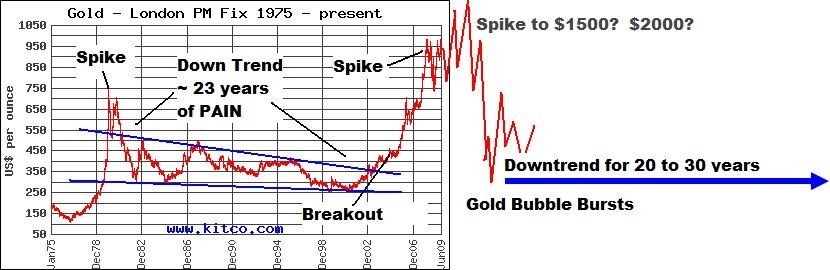
Let’s begin by looking at a gold price chart from 1975 to 2009. Note that gold prices in this chart have NOT been adjusted for inflation.
If you bought gold any time between 1980 and 1998 and held it, you lost out—UNLESS you made a short-term trade, or exited after a couple of years.
Depending on when you bought it, you had to wait until anywhere from between 2004 and 2008 in order to make money (these periods have been roughly estimated, but you can get the general idea by studying the price chart below).
Okay so let’s assume you bought gold, held it for several years, and then sold it at a higher price. Did you really make a profit? Chances are, if you held gold for several years, you actually lost money after adjusting for inflation.
Let’s take a look at investors who held gold for 20 years. If you bought gold in 1990 for around $375, you had to wait for the recent gold bubble to make money after adjusting for inflation. But your annual rate of return would have only been around 1 or 2%.
Those who bought gold in 1998 or 2000 have done much better – so far. But they could lose these gains if they fail to cash out before the bubble implodes.
If you bought gold for say $250 in 2000, you’ve done quite well with a buy-and-hold approach, largely because you happened to have bought it just prior to the gold bull market. And because your holding period hasn’t been that long, the effects of inflation are small relative to the price appreciation.
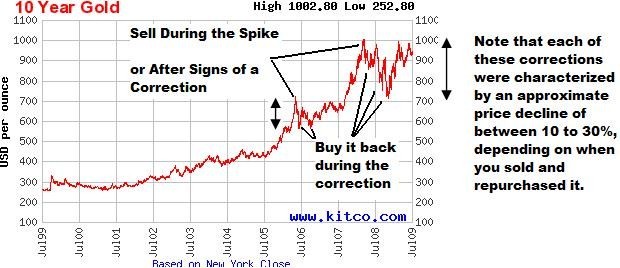
Regardless, the fact is you could have done much better by trading it. Even if you aren’t a great trader there have been a couple of fairly substantial price corrections since the beginning of the gold bull market in 2002.
If you were able to recognize these periods, you could have sold high and reentered low. This would have lowered your cost basis while reducing short-term liquidity risk. These two periods were easy to spot if you understand basic dynamics of asset price movements.
But as you can imagine, even this recent spike in the price of gold hasn’t combated the effects of inflation for those who held it for a longer period. So they did NOT make money.
In fact, they may have lost a good deal of money (depending upon how long they held it and what price they paid) due to the effects of inflation. Generally speaking, the longer they held gold, the more they lost.
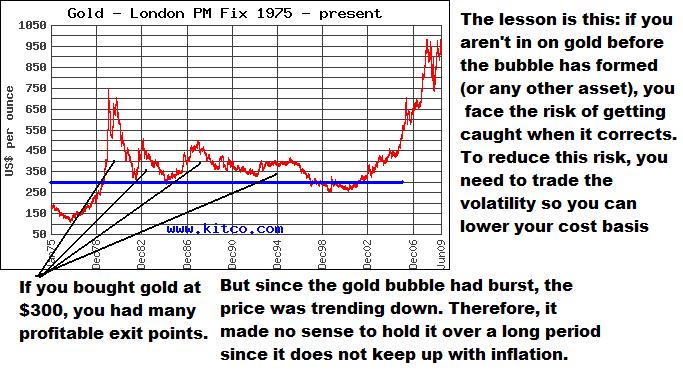
In the chart below, I demonstrate several scenarios for an investor that bought gold at $400. If this investor happened to buy gold closer to the commencement of the bull market, he or she would have done much better.
When you adjust the price of gold bought any time during this twenty-year period with inflation, you would have lost money if you held it.
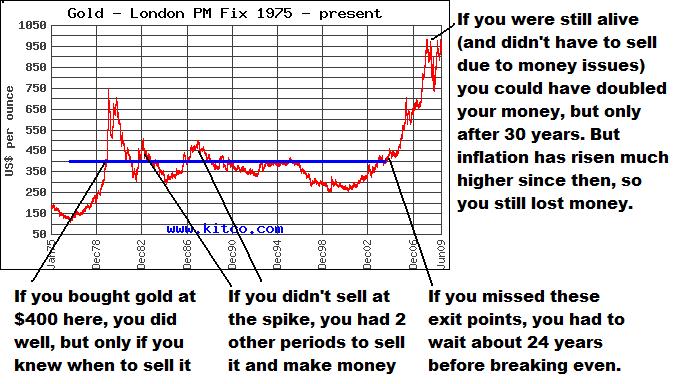
Therefore, when it comes to investing in gold, TIME isn’t on your side because the effects of compounding inflation add up. It’s much more important to have good TIMING. This means you need to carefully pick your entry and exit prices, while making sure to keep your investment horizon short enough so that the effects of inflation don’t neutralize any price appreciation.
You might imagine why gold dealers like Kitco and gold bugs never post charts of gold’s REAL value in today’s dollars. The gold-selling business (at least for investment purposes) wouldn’t do so well.
Instead, they show you charts of gold adjusted for inflation, which has no relevance since we are no longer on the gold standard.
Let’s see why.
Today, the inflation-adjusted price of gold from its previous high of around $900 in 1980 is roughly equal to $2200. That means gold SHOULD be $2200 today, BUT ONLY IF IT WAS LINKED TO INFLATION; but it’s not.
The real value of gold (in today’s dollars) would only be linked to annual inflation if we were still on the gold standard.
Remember, inflation is a monetary phenomenon, so any asset expected to be linked to inflation must in some way be linked to the dollar. Oil is linked to the dollar, as I have discussed on many occasions. Gold is NOT.
So, for those who may have bought gold in 1980 at $900/ounce, the real value is only about $350 in today's dollars (roughly estimated based on a reasonable inflation rate compounded over 30 years).
Why might this be? Because annual inflation caused gold (purchased in 1980) to lose about 60% of its value since it’s not linked to the dollar, and thus does not adjusted for inflation. You can determine the real value of gold in today’s dollars at any price you paid as long as you know the compounded inflation rate since you bought it.
Interestingly, when you see “inflation-adjusted” price charts for gold, you ALWAYS see the price as IF INFLATION WAS FACTORED into the price of gold. But these assumptions are invalid since gold is in no way linked to inflation, since it’s no longer linked to the dollar.
Instead, you should be shown the REAL VALUE OF GOLD IN TODAY’S DOLLARS; that is, the buying power of gold based on the effects of inflation during your holding period.
Good luck.
You won’t ever see these charts because the gold bugs are trying to sell you gold and/or pump up the price.
Now that the next gold bubble has formed, the gold bugs have everyone focused on the current price of gold, reminding you that it has more than quadrupled in the past 10 years. Rather than a reason to buy gold now, it’s more of a reason to be cautious in my opinion.
Still not convinced that gold does poorly during inflation? Let’s examine a shorter time period. In fact, let’s take a look at the past two years.
As you can see from the chart below, gold began taking off in the fall of 2007. That was the period when problems with Countrywide were brewing. At the time, while inflation was on the rise, it had not yet taken off.
Gold hit a record high of just over $1000 in mid-March 2008 during the Bear Stearns collapse (heist). Thereafter, gold has traded down, with several volatility spikes along the way. By early 2008, inflation was weighing in on the economy. By the summer, inflation had soared. Meanwhile, gold was still trending downward since its March highs.
A few months after reaching its all-time high, we also experienced numerous additional shocks to the financial system - Lehman and Washington Mutual went under, Fannie, Freddie and AIG were bailed out, TARP was passed, etc.
As you can see from the chart, gold spiked and corrected many times since reaching its March 2008 highs. But it’s lower now than during the peak inflation period in the summer of 2008.
Ask yourself why…why has the price of gold been lower than highs reached in March 2008? All of the real damage occurred AFTER that period, including a spike in the commodities bubble which caused inflation to go through the roof. Yet, all we have seen are spikes in gold, followed by sell-offs.
Why did gold spike and correct many times over this period? We had many crises.
The reason for the spikes and corrections is that gold is a hedge against crises. And crises are short-term events.
If gold were a hedge against inflation, it would have made new highs throughout the spring and summer of 2008 when inflation was at its highs. Instead it did the opposite.
As you can see, the brief deflationary period in the fall of 2008 (due to the banking crisis) actually caused gold to gain its previous strength.
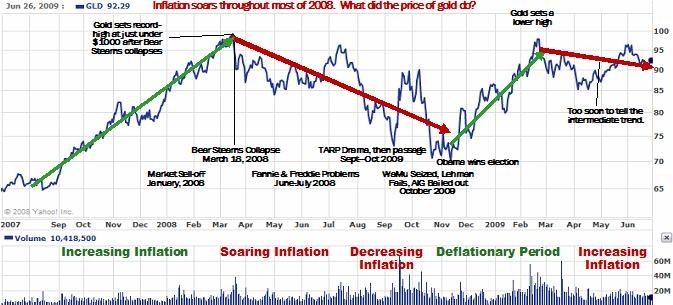
Finally, by early 2009, inflation was on the rise again, but gold has been trending downward.
This chart further illustrates that gold serves as a hedge against deflation and other crises rather than inflation.
It also serves to highlight another important point. Investors who intend to take a buy-and-hold approach with gold should ONLY be concerned with the long-term moving average, which sets the price trend. And if that trend isn’t going up, they should consider selling their position during the next spike. Otherwise, they could get stuck when the bubble pops.
As a caveat, investors who buy gold during the early- to mid-stages of a bull market or bubble can afford to be longer term investors, while the late arrivals need to focus on short-term trading or a short investment horizon.
In contrast, those who elect to trade the volatility swings in gold don’t care so much about the price trend. As the gold bubble approaches its final stages, you can see why it’s best to adapt a shorter-term mentality; that is if you want to avoid getting stuck with gold after the bubble pops.
So the main question becomes…where along the bubble is gold?
It’s impossible for anyone to determine, but if I had to make a guess, I’d say it’s in the middle stages. If that is the case, it’s likely the bubble still has a few more years left. And I’d expect gold to go higher from these levels. I have no reason to alter my gold price forecast made in 2006.
Although there are many variables involved, generally speaking, you’re not likely to do particularly well investing in gold unless you bought it at for under $600, you trade it regularly, or your holding period is only a couple of years (depending on when you bought it).
For any period beyond this, you face the risk of holding the empty bag when gold corrects, much like those who bought it in 1980. If that happens, you’ll have the added effects of inflation eating away at your principal. The modified chart below illustrates this.
No one knows where gold is headed or when the bubble will burst. The gold bugs are unwilling to even acknowledge that there is a gold bubble forming. Just remember this - the higher it goes, the harder it will fall. This is how all asset bubbles play out. And if you get stuck holding gold when the bubble bursts, you could end up losing a lot of money, especially since gold fails to keep up with inflation over long periods; periods that typify post-bubble corrections.
While you’re waiting years to break even before you sell, inflation will gradually eat away at your principal.
The lesson is—buy-and-hold doesn’t work. It never did; not for stocks, not for oil, and certainly NOT for gold. Timing DOES matter, but so does valuation. If you’re good at one and not the other, you can still do pretty good. If you’re good at both, you’ll join a very elite group of investors whose names you probably don’t know.
Now if you still doubt what I say, check back with me in say 15 or 20 years. By then, gold will likely have come down (from whatever high it makes) to $400, and maybe $300 per ounce. I’m willing to bet on it.
Until then, gold is likely to go higher. But unless you really understand the dynamics of gold price movements, or unless you trade the volatility, you’ll most likely get burned if you buy gold at current levels.
Remember, the higher price you pay, the more risk you add because this bubble WILL eventually burst. Only by understanding the realities about gold can you plan for a profitable exit.
In Part 3, I’m going to show you the real value of gold as an asset class.